


Chapter 13: Hemorrhoids
James E. Everhart, M.D., M.P.H.
Hemorrhoids are classified as diseases of the circulatory system by ICD-9 and ICD-10 (Appendix 1), but are much more often diagnosed and treated by digestive disease specialists than by those with a primary interest in the circulatory system. Therefore, burden data for hemorrhoids are presented in this report. Hemorrhoids are subclassified by anatomical location (internal or external) and whether they are complicated with bleeding, prolapse, strangulation, or ulceration. Hemorrhoids are common, and their treatment is primarily in the ambulatory care setting. In 2004, there were an estimated 2 million ambulatory care visits with hemorrhoids as first-listed diagnosis and 3.2 million visits at which hemorrhoids were an all-listed diagnoses (Table 1), which made hemorrhoids the fourth or fifth leading outpatient digestive system diagnosis (after GERD, abdominal wall hernia, and functional disorders, and essentially tied with diverticular disease). Visit rates were highest among persons age 65 years and older and among whites. Age-adjusted rates were similar for males and for females. Most hospitalizations for hemorrhoids are for surgery, which is performed most often as same-day surgery; thus, the number of hospitalizations for hemorrhoids was small relative to the number of ambulatory care visits (Table 1). As opposed to rates of ambulatory care visits, age-adjusted hospitalization rates were higher for blacks than whites. Hemorrhoids were most often listed as a secondary diagnosis (87 percent).
Age-adjusted ambulatory care visits for hemorrhoids declined slightly between the periods of 1992–1993 and 2003–2005 (Figure 1). The rate of visits in this latter period was about 20 percent lower than in the early 1980s, continuing a trend in declining outpatient visits that began in the 1960s.4 Overnight hospitalizations with hemorrhoids listed as a diagnosis declined by about 60 percent from 1981 to 1994, and were relatively stable for the following 10 years. As a first-listed hospital diagnosis, hemorrhoids declined much more: from about 70 per 100,000 in 1979 to 13 per 100,000 in 2004.5
Death from hemorrhoids has always been exceedingly rare (Table 2 and Figure 2). There was a substantial decline from 1980 through 2004 in hemorrhoids noted as a diagnosis on death certificates.
Nearly 2 million prescriptions for hemorrhoids were filled at retail pharmacies in 2004, according to Verispan (Appendix 2), with topical medications such as pramoxine (pramocaine) and hydrocortisone and stool softeners such as psyllium most often prescribed (Table 3). Most persons with hemorrhoids do not seek medical care and are self-treated using nonprescription medications similar to those listed in Table 3; thus the totals in this table were a small portion of the number and cost of medications used to treat hemorrhoids.6
References
Table 1. Hemorrhoids: Number and Age-Adjusted Rates of Ambulatory Care Visits and Hospital Discharges With First-Listed and All-Listed Diagnoses by Age, Race, and Sex in the United States, 2004
| Demographic Characteristics | Ambulatory Care Visits First-Listed Diagnosis Number in Thousands | Ambulatory Care Visits First-Listed Diagnosis Rate per 100,000 | Ambulatory Care Visits All-Listed Diagnosis Number in Thousands | Ambulatory Care Visits All-Listed Diagnosis Rate per 100,000 | Hospital Discharges First-Listed Diagnosis Number in Thousands | Hospital Discharges First-Listed Diagnosis Rate per 100,000 | Hospital Discharges All-Listed Diagnosis Number in Thousands | Hospital Discharges All-Listed Diagnosis Rate per 100,000 |
|---|---|---|---|---|---|---|---|---|
| AGE (Years) Under 15 |
— | — | — | — | — | — | 1 | 1 |
| AGE (Years) 15–44 |
716 | 569 | 1,131 | 899 | 8 | 7 | 57 | 46 |
| AGE (Years) 45–64 |
915 | 1,294 | 1,331 | 1,883 | 13 | 19 | 96 | 136 |
| AGE (Years) 65+ |
387 | 1,065 | 790 | 2,174 | 16 | 45 | 152 | 418 |
| Race White |
1,819 | 724 | 2,915 | 1,161 | 29 | 11 | 245 | 96 |
| Race Black |
145 | 421 | 234 | 656 | 6 | 19 | 45 | 150 |
| Sex Female |
944 | 621 | 1,745 | 1,132 | 19 | 12 | 179 | 110 |
| Sex Male |
1,092 | 751 | 1,531 | 1,061 | 19 | 14 | 127 | 95 |
| Total | 2,036 | 693 | 3,275 | 1,115 | 38 | 13 | 306 | 104 |
Figure 1. Hemorrhoids: Age-Adjusted Rates of Ambulatory Care Visits and Hospital Discharges With All–Listed Diagnoses in the United States, 1979–2004
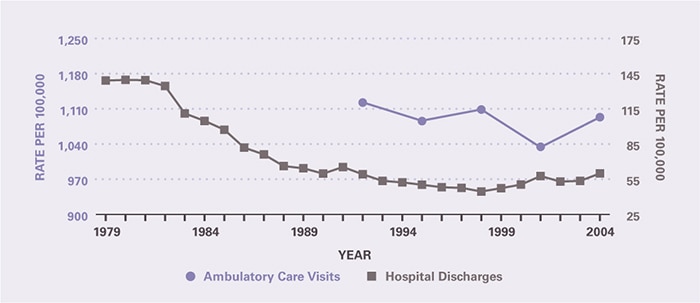
Table 2. Hemorrhoids: Number and Age-Adjusted Rates of Deaths and Years of Potential Life Lost (to Age 75) by Age, Race, and Sex in the United States, 2004
| Demographic Characteristics | Underlying Cause Number of Deaths | Underlying Cause Rate per 100,000 | Underlying Cause Years of Potential Life Lost in Thousands | Underlying or Other Cause Number of Deaths | Underlying or Other Cause Rate per 100,000 |
|---|---|---|---|---|---|
| AGE (Years) Under 15 |
— | — | — | — | — |
| AGE (Years) 15–44 |
2 | 0.0 | 0.1 | 5 | 0.0 |
| AGE (Years) 45–64 |
8 | 0.0 | 0.2 | 22 | 0.0 |
| AGE (Years) 65+ |
4 | 0.0 | 0.0 | 30 | 0.1 |
| Race White |
9 | 0.0 | 0.1 | 42 | 0.0 |
| Race Black |
2 | 0.0 | 0.0 | 9 | 0.0 |
| Sex Female |
3 | 0.0 | 0.0 | 21 | 0.0 |
| Sex Male |
11 | 0.0 | 0.2 | 36 | 0.0 |
| Total | 14 | 0.0 | 0.2 | 57 | 0.0 |
Figure 2. Hemorrhoids: Age-Adjusted Rates of Death in the United States, 1979–2004
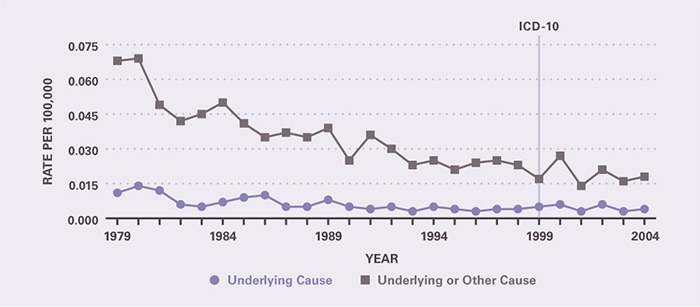
Table 3. Hemorrhoids: Costliest Prescriptions
| DRUG | Prescription (#) | Prescription | Retail Cost | Cost |
|---|---|---|---|---|
| Pramoxine/Hydrocortisone | 336,508 | 16.9% | $19,424,146 | 45.1% |
| Hydrocortisone | 989,521 | 49.8 | 14,852,947 | 34.5 |
| Hydrocortisone/Lidocaine | 98,928 | 5.0 | 6,288,920 | 14.6 |
| Docusate | 511,791 | 25.7 | 1,672,743 | 3.9 |
| Hydrocodone/Acetaminophen | 15,223 | 0.8 | 437,436 | 1.0 |
| Oxycodone/Acetaminophen | 2,550 | 0.1 | 116,818 | 0.3 |
| Psyllium | 7,715 | 0.4 | 80,312 | 0.2 |
| Polycarbophil | 14,496 | 0.7 | 43,635 | 0.1 |
| Bismuth subgallate/Zinc oxide/Balsam | 4,099 | 0.2 | 42,819 | 0.1 |
| Ibuprofen/Hydrocodone | 858 | 0.0 | 25,637 | 0.1 |
| Other | 4,296 | 0.2 | 39,848 | 0.0 |
| Total | 1,985,985 | 100.0% | $43,025,261 | 100.0% |
This content is provided as a service of the National Institute of Diabetes and Digestive and Kidney Diseases
(NIDDK), part of the National Institutes of Health. NIDDK translates and disseminates research findings to increase knowledge and understanding about health and disease among patients, health professionals, and the public. Content produced by NIDDK is carefully reviewed by NIDDK scientists and other experts.